Paper
ECplot: An online tool for making standardized plots from large datasets for bioinformatics publications……【阅读全文】
1 2 3 4 5 6 7 8 9 10 11 12 13 14 | #安装limma包 #source("http://www.bioconductor.org/biocLite.R") #biocLite("limma") #载入limma包 library(limma) hsb2 《- read.table("http://www.ats.ucla.edu/stat/R/notes/hsb2.csv", sep=',', header=T) attach(hsb2) hw 《- (write《=60) hm 《- (math 《=60) hr 《- (read 《=60) c3 《- cbind(hw, hm, hr) a 《- vennCounts(c3) vennDiagram(a, include = "both", names = c("High Writing", "High Math", "High Reading"), cex = 1, counts.col = "red") |
1 2 3 4 5 6 7 8 9 10 11 12 13 | #安装gplots包 #install.packages("gplots") #载入gplots包 library(gplots) oneName 《- function() paste(sample(LETTERS,5,replace=TRUE),collapse="") geneNames 《- replicate(1000, oneName()) GroupA 《- sample(geneNames, 400, replace=FALSE) GroupB 《- sample(geneNames, 750, replace=FALSE) GroupC 《- sample(geneNames, 250, replace=FALSE) GroupD 《- sample(geneNames, 300, replace=FALSE) input 《-list(GroupA,GroupB,GroupC,GroupD) venn(input) |
693ef5cd2d205830942f71a4cace6c67002……【阅读全文】
为了方便演示,先虚构一套数据,如下所示:……【阅读全文】
Script
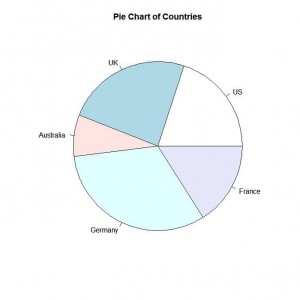
1 2 3 | slices <- c(10, 12,4, 16, 8) lbls <- c("US", "UK", "Australia", "Germany", "France") pie(slices, labels = lbls, main="Pie Chart of Countries") |
Output

Continue reading
注意:请将代码中的“》”(中文全角)全部替换为“>”(英文半角)。
代码:
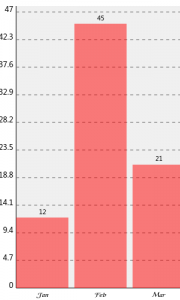
1 2 3 4 5 6 7 8 9 10 11 12 13 14 15 16 17 18 19 20 21 22 23 24 25 26 27 | #!/use/bin/perl use SVG::TT::Graph::Bar; my @fields = qw(Jan Feb Mar); my @data_sales_02 = qw(12 45 21); my $graph = SVG::TT::Graph::Bar-》new( { 'height' =》 '500', 'width' =》 '300', 'fields' =》 @fields, } ); $graph-》add_data( { 'data' =》 @data_sales_02, 'title' =》 'Sales 2002', } ); open( my $fh, '》', "bar.svg" ); select $fh; binmode $fh; print $graph-》burn(); close($fh); |
输出:

Continue reading
《Building Bioinformatics Solutions with Perl, R and MySQL》(P162-163)……【阅读全文】
DOT语言是一种文本图形描述语言。它提供了一种简单的描述图形的方法,并且可以为人类和计算机程序所理解。DOT语言文件通常是具有.gv或是.dot的文件扩展名。
很多程序都可以处理DOT文件。其中的一些,例如dot,neato,twopi,circo, fdp与sfdp,会读取DOT文件并将之渲染成为图形格式。其它的一些,比如gvpr,gc,accyclic,ccomps,sccmap和tred,可以读取DOT文件并对它代表的图形进行一些处理。类似于GVedit,lefty,dotty和grappa则提供了交互式的界面。以上程序大部分都包括在了Graphviz软件包中。
Continue reading
在R中,如何实现在一幅图中绘制多个子图呢,特别是当子图是以群组(group)来归类的时候?下面提供两种解决方案:
先虚构一组数据:……【阅读全文】
通过使用plotrix包的pie3D命令,可以在R中绘制3D饼图。……【阅读全文】
Get every new post delivered to your Inbox
Join other followers