10月 28

[文献合集]Statistics notes from The BMJ

Statistics notes from The BMJ

  • Interpreting diagnostic accuracy studies for patient care
  • Brackets (parentheses) in formulas
  • How to obtain the P value from a confidence interval
  • Comparisons within randomised groups can be very misleading
  • Correlation in restricted ranges of data
  • Analysis of continuous data from small samples
  • Parametric v non-parametric methods for data analysis
  • Missing data
  • The cost of dichotomising continuous variables
  • Standard deviations and standard errors
  • Treatment allocation by minimisation
  • Diagnostic tests 4: likelihood ratios
  • The logrank test
  • Interaction revisited: the difference between two estimates
  • Validating scales and indexes
  • Analysing controlled trials with baseline and follow up measurements
  • Concealing treatment allocation in randomised trials
  • Blinding in clinical trials and other studies
……【阅读全文】

11月 02

[转载]关于统计-生物学家需要知道的五件事

全文提纲

  1. Non parametric statistics.
  2. R (or I guess S).
  3. The problem of multiple testing, and how to handle it, either with the Expected value, or FDR, and the backstop of many of piece of bioinformatics – large scale permutation.
  4. The relationship between Pvalue, Effect size, and Sample size.
  5. Linear models and PCA.

 ……【阅读全文】

10月 13

人类基因组中的基因密度、特征长度和SNP密度

一、源起

本周,在为本科生设计生物信息学实验的时候,突发奇想,想要利用Galaxy工具计算一下人类基因组的常识性信息,如:每条染色体上的基因密度,外显子、内含子等特征(feature)的平均长度,SNP在UTR、编码区、内含子等不同特征区域的密度。

二、工具

系统平台:Linux(Ubuntu 12.04,AMD64)。
UCSC Table:下载基因组数据至本地。
Galaxy:用于在线处理基因组数据。
BEDTools(v2.16.2):用于本地处理基因组数据
R(v2.15.1):绘制图表。
其他:Vim(v7.3.429)。

三、数据库

human genome:hg19
dbSNP:135

四、结果

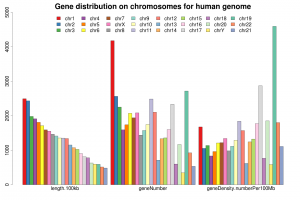
1.基因在每条染色体上的数目与密度。

  • 数据表格
chromosomelength.bplength.100kbgeneNumbergeneDensity.numberPer100Mb
chr12492506212492.5062141771675.82330718
chr22431993732431.9937325631053.86784858
chr31980224301980.224322511136.73991376
chr41911542761911.542761592832.835149343
chr51809152601809.15261739961.223503203
chr61711150671711.1506720711210.29669468
chr71591386631591.3866319401219.06264853
chrX1552705601552.705620831341.5292635
chr81463640221463.640221437981.79865541
chr91412134311412.1343115731113.91670669
chr101355347471355.3474717491290.4439922
chr111350065161350.0651624851840.65189861
chr121338518951338.5189521021570.39241021
chr131151698781151.69878711617.348921738
chr141073495401073.495413341242.66950748
chr151025313921025.3139213571323.49710028
chr1690354753903.5475316001770.79782399
chr1781195210811.952123312870.85900757
chr1878077248780.77248599767.188925511
chr2063025520630.255211671851.63089491
chrY59373566593.73566347584.435167664
chr1959128983591.2898327164593.34807095
chr2251304566513.045669241801.00929028
chr2148129895481.298955341109.49753786


  • 条形图展示

基因在每条染色体上的数目与密度
Continue reading

5月 30

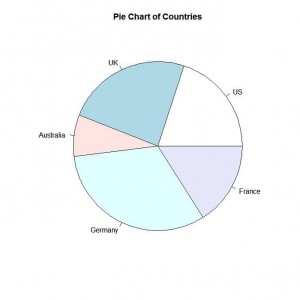
用R绘制饼图

  • Simple Pie Chart

Script

1
2
3
slices <- c(10, 12,4, 16, 8)
lbls <- c("US", "UK", "Australia", "Germany", "France")
pie(slices, labels = lbls, main="Pie Chart of Countries")

Output
pie1
Continue reading

5月 30

使用Perl绘制统计图

注意:请将代码中的“》”(中文全角)全部替换为“>”(英文半角)。

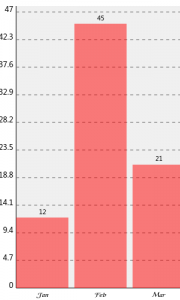
  • Bar

代码:

1
2
3
4
5
6
7
8
9
10
11
12
13
14
15
16
17
18
19
20
21
22
23
24
25
26
27
#!/use/bin/perl
 
use SVG::TT::Graph::Bar;
 
my @fields        = qw(Jan Feb Mar);
my @data_sales_02 = qw(12 45 21);
 
my $graph = SVG::TT::Graph::Bar-new(
  {
      'height' ='500',
      'width'  ='300',
      'fields' =@fields,
  }
);
 
$graph-》add_data(
  {
      'data'  =@data_sales_02,
      'title' ='Sales 2002',
  }
);
 
open( my $fh, '》', "bar.svg" );
select $fh;
binmode $fh;
print $graph-》burn();
close($fh);

输出:
bar
Continue reading