-
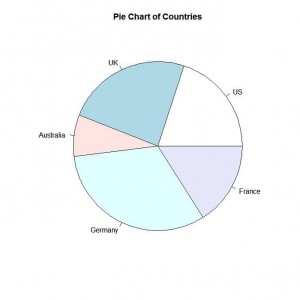
Simple Pie Chart
Script
1 2 3 | slices <- c(10, 12,4, 16, 8) lbls <- c("US", "UK", "Australia", "Germany", "France") pie(slices, labels = lbls, main="Pie Chart of Countries") |
Output

Continue reading
Script
1 2 3 | slices <- c(10, 12,4, 16, 8) lbls <- c("US", "UK", "Australia", "Germany", "France") pie(slices, labels = lbls, main="Pie Chart of Countries") |
Output

Continue reading
注意:请将代码中的“》”(中文全角)全部替换为“>”(英文半角)。
代码:
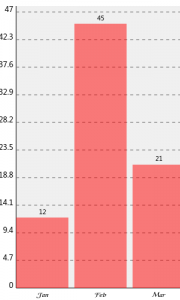
1 2 3 4 5 6 7 8 9 10 11 12 13 14 15 16 17 18 19 20 21 22 23 24 25 26 27 | #!/use/bin/perl use SVG::TT::Graph::Bar; my @fields = qw(Jan Feb Mar); my @data_sales_02 = qw(12 45 21); my $graph = SVG::TT::Graph::Bar-》new( { 'height' =》 '500', 'width' =》 '300', 'fields' =》 @fields, } ); $graph-》add_data( { 'data' =》 @data_sales_02, 'title' =》 'Sales 2002', } ); open( my $fh, '》', "bar.svg" ); select $fh; binmode $fh; print $graph-》burn(); close($fh); |
输出:

Continue reading
《Building Bioinformatics Solutions with Perl, R and MySQL》(P162-163)……【阅读全文】
1.可以加深对统计学基础概念的理解
2.通过源码可以学习lattice的使用方法
3.在源码中可以看到一些R的使用技巧……【阅读全文】
1 2 3 4 5 6 7 8 9 10 11 12 13 14 | plot.tri <- function(n = 1000, col ="blue", ani=FALSE, cex=1.2){ p <- runif(n); X <- rbind(rep(0, n), rep(0, n)) B <- cbind(c(0,0),c(0.25,0.433),c(0.5,0)) if(ani) plot(0,0,xlim=c(0,1),ylim=c(0,0.85),type="n",xlab="",ylab="") for(i in 2:n){ pp <- p[i]; ind <- rank(c(c(1/3,2/3,1), pp), ties.method="min")[4] X[,i] <- 0.5*X[,i-1] + B[,ind] if(ani) points(X[1,i], X[2,i],pch = ".", cex = 1, col = col) } if(!ani) plot(X[1,], X[2,],pch = ".", cex = cex, col = col, xlab="", ylab="") } plot.tri(100000, ani=TRUE) |
1 2 3 4 5 6 | n=50000; r=0.7;r_e=(1-r*r)^.5; X=rnorm(n); Y=X*r+r_e*rnorm(n); Y=ifelse(X>0,Y,-Y); plot(X,Y,col="pink") |
本福特定律,也称为本福德法则,说明一堆从实际生活得出的数据中,以1为首位数字的数的出现机率约为总数的三成,接近期望值1/9的3倍。推广来说,越大的数,以它为首几位的数出现的机率就越低。它可用于检查各种数据是否有造假。
一组平均增长的数据开始时,增长得较慢,由最初的数字a增长到另一个数字a + 1起首的数的时间,必然比a + 1起首的数增长到a + 2,需要更多时间,所以出现率就更高了。
从数数目来说,顺序从1开始数,1,2,3,…,9,从这点终结的话,所有数起首的机会似乎相同,但9之后的两位数10至19,以1起首的数又大大抛离了其他数了。而下一堆9起首的数出现之前,必然会经过一堆以2,3,4,…,8起首的数。若果这样数法有个终结点,以1起首的数的出现率一般都比9大。
Continue reading
igraph is a free software package for creating and manipulating undirected and directed graphs. It includes implementations for classic graph theory problems like minimum spanning trees and network flow, and also implements algorithms for some recent network analysis methods, like community structure search.……【阅读全文】
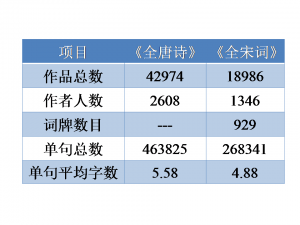
前两天看到了邱怡轩写的统计词话(一)。受其启发,决定利用自己的编程及统计分析能力,对《全唐诗》和《全宋词》进行一个较为全面的统计分析与比较。于是便有了你现在看到的这篇文章。
此处使用到的原始数据、程序脚本及结果图表等均可以在文末找到下载链接。
《全唐诗》及《全宋词》的原始数据均来自于网络。
通过基本的编码转换以及“简单”的过滤筛选之后,就得到了用于后续统计分析的数据。
系统平台:Linux(Ubuntu 10.10,AMD64)。
Shell命令行:转换编码(iconv)与换行符(fromdos)。
Perl(v5.10.1):用来过滤、筛选原始数据,得到可以用于后续分析的格式化数据。
R(v2.12.2):统计分析及图表绘制。
其他:Vim(v7.2.330),TimeForScience。

补充:只考虑诗或词的主体内容的话,《全唐诗》共使用了7513种(个)汉字,而《全宋词》则使用了5750种(个)汉字。
此处的统计数据仅为约数,与其他的数据有一定的出入。主要原因在于原始数据的质量以及数据处理过程中的过滤筛选等。
相关的参考数据:
百度百科:《全唐诗》共收录唐代诗人2529人,诗作42863首。
玄烨为《全唐诗》所作的序中的说法:诗48900余首,2200余人。
日本学者平冈武夫的统计结果:《全唐诗》共收诗49403首,句1555条,作者2873人。
维基百科:《全宋词》收录宋代词人1330家,词作21116首。
Continue reading
Get every new post delivered to your Inbox
Join other followers