为了方便演示,先虚构一套数据,如下所示:……【阅读全文】
Tag Archives: R
R Functions for Correlation Analysis
[推荐]一个专注于生物信息学系统与软件Manuals的网站
一个很好的Manuals网站,主要针对生物信息学的研究人员,包括R、Bioconductor、NGS、EMBOSS、Linux等软件和系统的手册。如:
R Basics Manual
Programming in R
Clustering in R
BioConductor Manual
NGS Analysis with R/Bioconductor
Linux Essentials……【阅读全文】
Bioconductor官网上的资料
R及LaTeX的入门资料
一点建议:通读《R for 初学者》;浏览《R 常见问题解答》;《R 导论》和《R语言简介》供深入学习;《R 参考卡片》供查阅。
PS1:一篇很好的文献(千万不要忽视补充材料奥!)。
PS2:如果你不喜欢纯命令行的操作,推荐使用RStudio。
PS3:一个Sweave的实例。……【阅读全文】
[更新]RStudio发布新版本v0.94
RStudio v0.94 is now(20110615) available. In this release we’ve made lots of enhancements based on the feedback we’ve received over the past few months. Highlights include new editor features like automatic indentation, brace matching, and function navigation as well as significantly improved plot exporting, package installation, and history management. Full details on everything included in the release can be found here: v0.94 release notes.……【阅读全文】
在R中使用paste批量建立输出文件
- paste
762aa938ad7c103aea35ffc33f042e5a004……【阅读全文】
How to plot histograms back to back
- Script
762aa938ad7c103aea35ffc33f042e5a006……【阅读全文】
用R绘制饼图
-
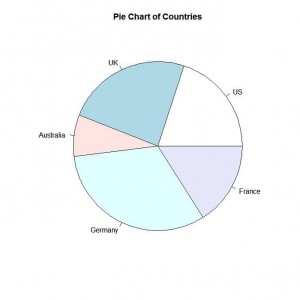
Simple Pie Chart
Script
1 2 3 | slices <- c(10, 12,4, 16, 8) lbls <- c("US", "UK", "Australia", "Germany", "France") pie(slices, labels = lbls, main="Pie Chart of Countries") |
Output

Continue reading
使用R绘制简单的序列图
-
资料来源
《Building Bioinformatics Solutions with Perl, R and MySQL》(P162-163)……【阅读全文】