不以年龄定大小,终要心态论长幼。
值此佳节,与君同庆!……【阅读全文】
6月
01
5月
31
为何兔子不吃窝边草
为何兔子不吃窝边草?
答案一:质量不好!
答案二:相依本草!……【阅读全文】
5月
30
在R中使用paste批量建立输出文件
- paste
f3ae25fab68563bd45d733dcdaf7768f000……【阅读全文】
5月
30
How to plot histograms back to back
- Script
f3ae25fab68563bd45d733dcdaf7768f002……【阅读全文】
5月
30
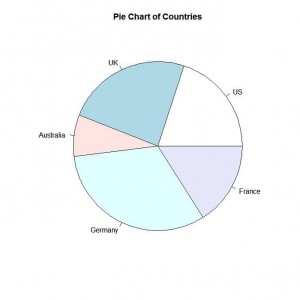
用R绘制饼图
-
Simple Pie Chart
Script
1 2 3 | slices <- c(10, 12,4, 16, 8) lbls <- c("US", "UK", "Australia", "Germany", "France") pie(slices, labels = lbls, main="Pie Chart of Countries") |
Output

Continue reading
5月
30
使用Perl绘制统计图
注意:请将代码中的“》”(中文全角)全部替换为“>”(英文半角)。
-
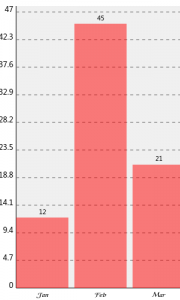
Bar
代码:
1 2 3 4 5 6 7 8 9 10 11 12 13 14 15 16 17 18 19 20 21 22 23 24 25 26 27 | #!/use/bin/perl use SVG::TT::Graph::Bar; my @fields = qw(Jan Feb Mar); my @data_sales_02 = qw(12 45 21); my $graph = SVG::TT::Graph::Bar-》new( { 'height' =》 '500', 'width' =》 '300', 'fields' =》 @fields, } ); $graph-》add_data( { 'data' =》 @data_sales_02, 'title' =》 'Sales 2002', } ); open( my $fh, '》', "bar.svg" ); select $fh; binmode $fh; print $graph-》burn(); close($fh); |
输出:

Continue reading
5月
30
无题
清晨纵横申沪,人车稀少,红绿虚设,喜而狂歌!……【阅读全文】
5月
27
查找删除重复文件的Perl脚本
-
注意
此程序未经广泛测试,请谨慎使用。……【阅读全文】
5月
26
使用R绘制简单的序列图
-
资料来源
《Building Bioinformatics Solutions with Perl, R and MySQL》(P162-163)……【阅读全文】
5月
24
在命令行中查字典
-
程序下载: