-
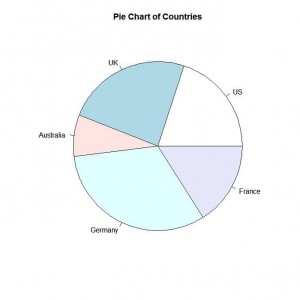
Simple Pie Chart
Script
1 2 3 | slices <- c(10, 12,4, 16, 8) lbls <- c("US", "UK", "Australia", "Germany", "France") pie(slices, labels = lbls, main="Pie Chart of Countries") |
Output

Continue reading
Script
1 2 3 | slices <- c(10, 12,4, 16, 8) lbls <- c("US", "UK", "Australia", "Germany", "France") pie(slices, labels = lbls, main="Pie Chart of Countries") |
Output

Continue reading
注意:请将代码中的“》”(中文全角)全部替换为“>”(英文半角)。
代码:
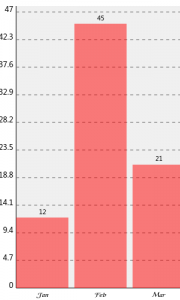
1 2 3 4 5 6 7 8 9 10 11 12 13 14 15 16 17 18 19 20 21 22 23 24 25 26 27 | #!/use/bin/perl use SVG::TT::Graph::Bar; my @fields = qw(Jan Feb Mar); my @data_sales_02 = qw(12 45 21); my $graph = SVG::TT::Graph::Bar-》new( { 'height' =》 '500', 'width' =》 '300', 'fields' =》 @fields, } ); $graph-》add_data( { 'data' =》 @data_sales_02, 'title' =》 'Sales 2002', } ); open( my $fh, '》', "bar.svg" ); select $fh; binmode $fh; print $graph-》burn(); close($fh); |
输出:

Continue reading
清晨纵横申沪,人车稀少,红绿虚设,喜而狂歌!……【阅读全文】
此程序未经广泛测试,请谨慎使用。……【阅读全文】
《Building Bioinformatics Solutions with Perl, R and MySQL》(P162-163)……【阅读全文】
帮助信息如下:……【阅读全文】
今天下午,参加完老师的新书(《我的传奇人生-昆仑山上空的燕子》)签售活动,就在书城逛了逛。这一逛不要紧,逛出了一个天大的笑话。一位推销英语辅导资料的女推销员拦住我,张口就是:“你是高中生吧?高几了?九几年的?四六级过了吗?……”……【阅读全文】
“师兄,你……不要……难过!”一句简简单单安慰陵越的话语;可是,需要安慰的又岂止师兄一个人?这句话又何尝不是在安慰自己?……【阅读全文】
Get every new post delivered to your Inbox
Join other followers