1
2
3
4
5
6
7
8
9
10
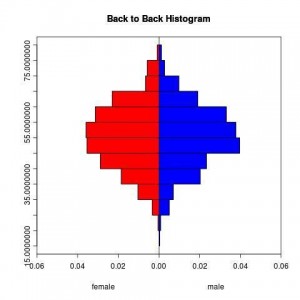
| library(Hmisc)
age <- rnorm(1000,50,10)
sex <- sample(c('female','male'),1000,TRUE)
# output to file
#pdf("histbackback.pdf")
out <- histbackback(split(age,sex), probability=TRUE, xlim=c(-.06,.06), main='Back to Back Histogram')
# just adding color
barplot(-out$left, col="red", horiz=TRUE, space=0, add=TRUE, axes=FALSE)
barplot(out$right, col="blue", horiz=TRUE, space=0, add=TRUE, axes=FALSE)
#dev.off() |
library(Hmisc)
age <- rnorm(1000,50,10)
sex <- sample(c('female','male'),1000,TRUE)
# output to file
#pdf("histbackback.pdf")
out <- histbackback(split(age,sex), probability=TRUE, xlim=c(-.06,.06), main='Back to Back Histogram')
# just adding color
barplot(-out$left, col="red", horiz=TRUE, space=0, add=TRUE, axes=FALSE)
barplot(out$right, col="blue", horiz=TRUE, space=0, add=TRUE, axes=FALSE)
#dev.off()

相关
