-
资料来源
《Building Bioinformatics Solutions with Perl, R and MySQL》(P162-163)
-
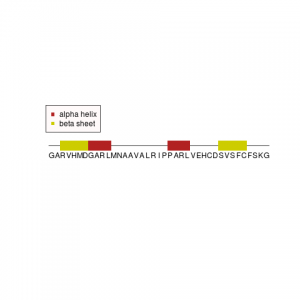
结果展示
-
程序源码
1 2 3 4 5 6 7 8 9 10 11 12 13 14 15 16 17 18 19 20 21 22 23 24 25 26 27 28 | # SSSEQ.R # Simple R program to display a sequence with structural anotation # define sequence and secondary structure seq <- "GARVHMDGARLMNAAVALRIPPARLVEHCDSVSFCFSKG" struct <- c(0,0,2,2,2,2,2,1,1,1,1,0,0,0,0,0,0,0,0,0,0,1,1,1,1,0,0,0,0,0,2,2,2,2,2,0,0,0,0) residuecount <- 39 # set up the window for poltting x11() plot.new() plot.window(c(0,40),c(-20,20)) # plot a line representing the length of the sequence segments(0.5,0,39.5,0) # plot the sequence and feature for(i in 1:residuecount){ text(i,-2,substr(seq,i,i)) if(struct[i] != 0){ if(struct[i] == 1) boxcolour <- "firebrick" # alpha helix if(struct[i] == 2) boxcolour <- "yellow3" # beta sheet rect(i-0.5,-1,i+0.5,1,col=boxcolour,border=NA) } } # plot a legend legend(x=0,y=8,legend=(c("alpha helix","beta sheet")),pch=15,col=c("firebrick","yellow3"),bg="snow") |
