1.
1
2
3
4
5
6
7
8
9
10
11
12
13
14
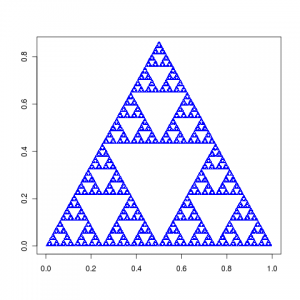
| plot.tri <- function(n = 1000, col ="blue", ani=FALSE, cex=1.2){
p <- runif(n);
X <- rbind(rep(0, n), rep(0, n))
B <- cbind(c(0,0),c(0.25,0.433),c(0.5,0))
if(ani) plot(0,0,xlim=c(0,1),ylim=c(0,0.85),type="n",xlab="",ylab="")
for(i in 2:n){
pp <- p[i];
ind <- rank(c(c(1/3,2/3,1), pp), ties.method="min")[4]
X[,i] <- 0.5*X[,i-1] + B[,ind]
if(ani) points(X[1,i], X[2,i],pch = ".", cex = 1, col = col)
}
if(!ani) plot(X[1,], X[2,],pch = ".", cex = cex, col = col, xlab="", ylab="")
}
plot.tri(100000, ani=TRUE) |
plot.tri <- function(n = 1000, col ="blue", ani=FALSE, cex=1.2){
    p <- runif(n);
    X <- rbind(rep(0, n), rep(0, n))
    B <- cbind(c(0,0),c(0.25,0.433),c(0.5,0))
    if(ani) plot(0,0,xlim=c(0,1),ylim=c(0,0.85),type="n",xlab="",ylab="")
    for(i in 2:n){
        pp <- p[i];
        ind <- rank(c(c(1/3,2/3,1), pp), ties.method="min")[4]
        X[,i] <- 0.5*X[,i-1] + B[,ind]
        if(ani) points(X[1,i], X[2,i],pch = ".", cex = 1, col = col)
    }
    if(!ani) plot(X[1,], X[2,],pch = ".", cex = cex, col = col, xlab="", ylab="")
}
plot.tri(100000, ani=TRUE)

2.
1
2
3
4
5
6
7
8
9
10
11
12
13
14
15
16
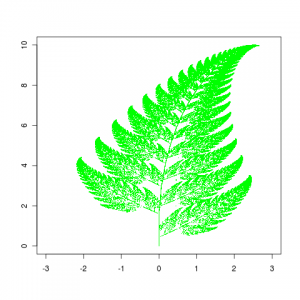
| plot.leaf <- function(n=100000, col="green",cex=2){
x <- c(.5, .5);
plot(x[1], x[2], xlim=c(-3, 3), ylim =c(0, 10),type="n",xlab="", ylab="")
p <- c( .85, .92, .99, 1.00);
A <- rbind(c(.85, .04), c(-.04,.85), c(.20,-.26), c(.23,.22),
c(-.15,.28), c(.26,.24), c(0, 0), c(0, .16))
B <- cbind(c(0, 1.6), c(0, 1.6), c(0,.44), c(0,0))
for (i in 1:n){
ran <- runif(1);
ind <- rank(c(p, ran), ties.method="min")[5]
x <- A[(2*ind-1):(2*ind),]%*%x + B[,ind]
points(x[1],x[2], pch=".", cex=cex, col=col)
}
}
plot.leaf(cex=1.6) |
plot.leaf <- function(n=100000, col="green",cex=2){
    x <- c(.5, .5);
    plot(x[1], x[2], xlim=c(-3, 3), ylim =c(0, 10),type="n",xlab="", ylab="")
    p <- c( .85,  .92,  .99,  1.00);
    A <- rbind(c(.85, .04), c(-.04,.85), c(.20,-.26), c(.23,.22),
    c(-.15,.28), c(.26,.24),  c(0, 0), c(0, .16))
    B <- cbind(c(0, 1.6), c(0, 1.6), c(0,.44), c(0,0))

    for (i in 1:n){
        ran  <-  runif(1);
        ind <- rank(c(p, ran), ties.method="min")[5]
        x <- A[(2*ind-1):(2*ind),]%*%x + B[,ind]
        points(x[1],x[2], pch=".", cex=cex, col=col)
    }
}
plot.leaf(cex=1.6)

3.
1
2
3
4
5
6
7
8
9
10
11
12
13
14
15
16
17
18
19
20
21
22
23
24
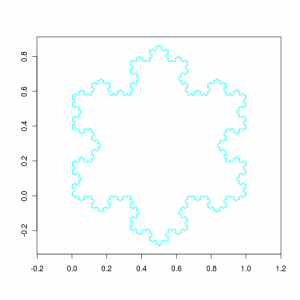
| plot.koch <- function(k,col="blue"){
plot(0,0,xlim=c(0,1), ylim=c(-sqrt(3)/6,sqrt(3)/2), asp = 1,type="n",xlab="", ylab="")
plotkoch <- function(x1,y1,x2,y2,n){
if (n > 1){
plotkoch(x1,y1,(2*x1+x2)/3,(2*y1+y2)/3,n-1);
plotkoch((2*x1+x2)/3,(2*y1+y2)/3,(x1+x2)/2-(y1-y2)*sqrt(3)/6,(y1+y2)/2-(x2-x1) *sqrt(3)/6,n-1);
plotkoch((x1+x2)/2-(y1-y2)*sqrt(3)/6,(y1+y2)/2-(x2-x1)*sqrt(3)/6,(2*x2+x1)/3,(2 *y2+y1)/3,n-1);
plotkoch((2*x2+x1)/3,(2*y2+y1)/3,x2,y2,n-1)
} else {
x=c(x1,(2*x1+x2)/3,(x1+x2)/2-(y1-y2)*sqrt(3)/6,(2*x2+x1)/3,x2);
y=c(y1,(2*y1+y2)/3,(y1+y2)/2-(x2-x1)*sqrt(3)/6,(2*y2+y1)/3,y2);
lines(x,y,type="l",col=col)
}
}
plotkoch(0,0,1,0,k)
plotkoch(0.5,sqrt(3)/2,0,0,k)
plotkoch(1,0,0.5,sqrt(3)/2,k)
}
## example
for(i in 1:5){
plot.koch(i,col=i)
Sys.sleep(1)
} |
plot.koch <- function(k,col="blue"){
    plot(0,0,xlim=c(0,1), ylim=c(-sqrt(3)/6,sqrt(3)/2), asp = 1,type="n",xlab="", ylab="")
    plotkoch <- function(x1,y1,x2,y2,n){
        if (n > 1){
            plotkoch(x1,y1,(2*x1+x2)/3,(2*y1+y2)/3,n-1);
            plotkoch((2*x1+x2)/3,(2*y1+y2)/3,(x1+x2)/2-(y1-y2)*sqrt(3)/6,(y1+y2)/2-(x2-x1) *sqrt(3)/6,n-1);
            plotkoch((x1+x2)/2-(y1-y2)*sqrt(3)/6,(y1+y2)/2-(x2-x1)*sqrt(3)/6,(2*x2+x1)/3,(2 *y2+y1)/3,n-1);
            plotkoch((2*x2+x1)/3,(2*y2+y1)/3,x2,y2,n-1)
        }    else {
            x=c(x1,(2*x1+x2)/3,(x1+x2)/2-(y1-y2)*sqrt(3)/6,(2*x2+x1)/3,x2);
            y=c(y1,(2*y1+y2)/3,(y1+y2)/2-(x2-x1)*sqrt(3)/6,(2*y2+y1)/3,y2);
            lines(x,y,type="l",col=col)
        }
    }
    plotkoch(0,0,1,0,k)
    plotkoch(0.5,sqrt(3)/2,0,0,k)
    plotkoch(1,0,0.5,sqrt(3)/2,k)
}

## example
for(i in 1:5){
    plot.koch(i,col=i)
    Sys.sleep(1)
}

4.
1
2
3
4
5
6
7
8
9
10
11
12
13
14
15
16
17
18
19
20
21
22
23
24
25
26
27
28
29
30
31
32
33
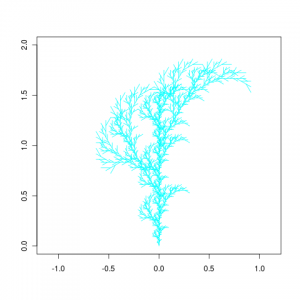
| plot.tree <- function(x1,y1,x2,y2,n,xlim=c(-1,1), ylim=c(0,2), col="blue", add=FALSE){
if(!add)
plot(0,0,xlim=xlim, ylim=ylim, type="n",xlab="", ylab="",asp=1)
tree <- function(x1,y1,x2,y2,n){
flag <- 0;
theta <- pi/6;
if (x2 < x1) flag <- 1;
if (n>1){
tree(x1,y1,(2*x1+x2)/3,(2*y1+y2)/3,n-1);
tree((2*x1+x2)/3,(2*y1+y2)/3,(2*x2+x1)/3,(2*y2+y1)/3,n-1);
tree((2*x2+x1)/3,(2*y2+y1)/3,x2,y2,n-1);
tree((2*x1+x2)/3,(2*y1+y2)/3,(2*x1+x2)/3+sin(pi/2-atan((y2-y1)/(x2-x1))-theta+flag*pi)*sqrt(((y2-y1)^2+(x2-x1)^2)/3),(2*y1+y2)/3+cos(pi/2-atan((y2-y1)/(x2-x1))-theta+flag*pi)*sqrt(((y2-y1)^2+(x2-x1)^2)/3),n-1);
tree((2*x2+x1)/3,(2*y2+y1)/3,(2*x2+x1)/3+sin(pi/2-atan((y2-y1)/(x2-x1))+theta+flag*pi)*sqrt(((y2-y1)^2+(x2-x1)^2)/3),(2*y2+y1)/3+cos(pi/2-atan((y2-y1)/(x2-x1))+theta+flag*pi)*sqrt(((y2-y1)^2+(x2-x1)^2)/3),n-1);
} else {
x <- c(x1,x2);
y <- c(y1,y2);
xx <- c((2*x1+x2)/3,(2*x1+x2)/3+sin(pi/2-atan((y2-y1)/(x2-x1))-theta+flag*pi)*sqrt(((y2-y1)^2+(x2-x1)^2)/3));
yy <- c((2*y1+y2)/3,(2*y1+y2)/3+cos(pi/2-atan((y2-y1)/(x2-x1))-theta+flag*pi)*sqrt(((y2-y1)^2+(x2-x1)^2)/3));
xxx <- c((2*x2+x1)/3,(2*x2+x1)/3+sin(pi/2-atan((y2-y1)/(x2-x1))+theta+flag*pi)*sqrt(((y2-y1)^2+(x2-x1)^2)/3));
yyy <- c((2*y2+y1)/3,(2*y2+y1)/3+cos(pi/2-atan((y2-y1)/(x2-x1))+theta+flag*pi)*sqrt(((y2-y1)^2+(x2-x1)^2)/3));
lines(x, y, type="l",col=col)
lines(xx, yy, type="l",col=col)
lines(xxx, yyy, type="l",col=col)
}
}
tree(x1,y1,x2,y2,n)
}
## example
for(i in 1:5){
plot.tree(0,0,0,1.5,i,col=i)
Sys.sleep(1)
} |
plot.tree <- function(x1,y1,x2,y2,n,xlim=c(-1,1), ylim=c(0,2), col="blue", add=FALSE){
    if(!add)
    plot(0,0,xlim=xlim, ylim=ylim, type="n",xlab="", ylab="",asp=1)
    tree <- function(x1,y1,x2,y2,n){
    flag <- 0;
    theta <- pi/6;
    if (x2 < x1) flag <- 1;
    if (n>1){
        tree(x1,y1,(2*x1+x2)/3,(2*y1+y2)/3,n-1);
        tree((2*x1+x2)/3,(2*y1+y2)/3,(2*x2+x1)/3,(2*y2+y1)/3,n-1);
        tree((2*x2+x1)/3,(2*y2+y1)/3,x2,y2,n-1);
        tree((2*x1+x2)/3,(2*y1+y2)/3,(2*x1+x2)/3+sin(pi/2-atan((y2-y1)/(x2-x1))-theta+flag*pi)*sqrt(((y2-y1)^2+(x2-x1)^2)/3),(2*y1+y2)/3+cos(pi/2-atan((y2-y1)/(x2-x1))-theta+flag*pi)*sqrt(((y2-y1)^2+(x2-x1)^2)/3),n-1);
        tree((2*x2+x1)/3,(2*y2+y1)/3,(2*x2+x1)/3+sin(pi/2-atan((y2-y1)/(x2-x1))+theta+flag*pi)*sqrt(((y2-y1)^2+(x2-x1)^2)/3),(2*y2+y1)/3+cos(pi/2-atan((y2-y1)/(x2-x1))+theta+flag*pi)*sqrt(((y2-y1)^2+(x2-x1)^2)/3),n-1);
    } else {
        x <- c(x1,x2);
        y <- c(y1,y2);
        xx <- c((2*x1+x2)/3,(2*x1+x2)/3+sin(pi/2-atan((y2-y1)/(x2-x1))-theta+flag*pi)*sqrt(((y2-y1)^2+(x2-x1)^2)/3));
        yy <- c((2*y1+y2)/3,(2*y1+y2)/3+cos(pi/2-atan((y2-y1)/(x2-x1))-theta+flag*pi)*sqrt(((y2-y1)^2+(x2-x1)^2)/3));
        xxx <- c((2*x2+x1)/3,(2*x2+x1)/3+sin(pi/2-atan((y2-y1)/(x2-x1))+theta+flag*pi)*sqrt(((y2-y1)^2+(x2-x1)^2)/3));
        yyy <- c((2*y2+y1)/3,(2*y2+y1)/3+cos(pi/2-atan((y2-y1)/(x2-x1))+theta+flag*pi)*sqrt(((y2-y1)^2+(x2-x1)^2)/3));
        lines(x, y, type="l",col=col)
        lines(xx, yy, type="l",col=col)
        lines(xxx, yyy, type="l",col=col)
        }
    }
    tree(x1,y1,x2,y2,n)
}

## example
for(i in 1:5){
    plot.tree(0,0,0,1.5,i,col=i)
    Sys.sleep(1)
}

5.资料来源
用R来玩分形
6.animation包
直接在R中观看这些分形图:
1
2
3
| demo(recur.leaf,package="animation")
demo(recur.snow,package="animation")
demo(recur.tree,package="animation") |
demo(recur.leaf,package="animation")
demo(recur.snow,package="animation")
demo(recur.tree,package="animation")
相关


分形艺术非常棒的!